Real-World Data for
Real-World Evidence

Gain actionable information with
STATinMED
RWD Insights

Real-Time Data

Real-world data repository from 2014 to present (30-day lag)

Care Settings

Longitudinal tracking across pharmacy and sites of care

Nationwide Reach

Patients from all US
geographic regions

Rapid Access

No delay to project kick-off

Patient Universe

Population = 300+ MM; de‑identified, tokenized,
HIPAA-compliant

Channel Capture

Commercial, Medicare FFS/Advantage, Medicaid (50 states)

Patient Tracking

Linked via direct matching algorithm

Payer Detail

Account details at
transaction level

Providers & Rx

97% of HCP specialties;

full life cycle of claims

Access Real-World Data with STATinMED RWD Insights

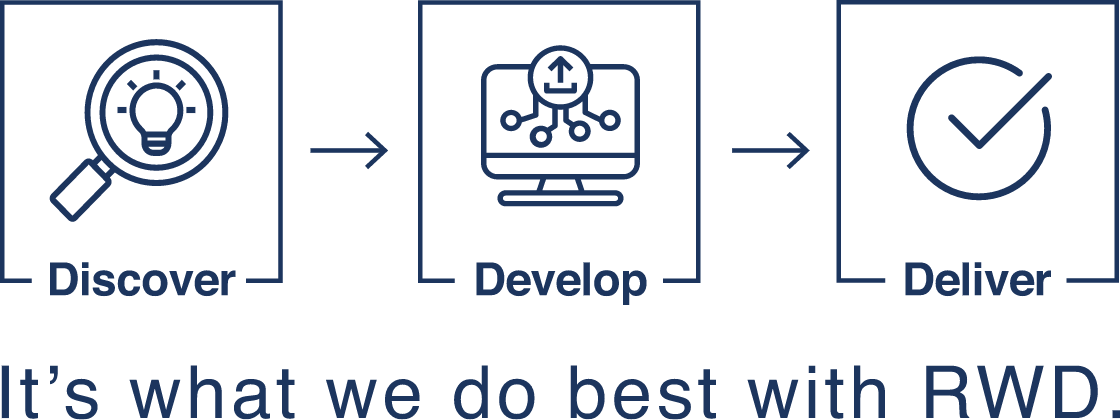
We help life science companies discover, develop, and deliver real-world evidence.


STATinMED RWD Insights is our robust, licensed, all-payer medical and pharmacy claims data source. It lets us explore more than 80% of the US healthcare system, with real-world patient-level data across all provider types to support a variety of evidence‑generation needs.

Navigate the
Data Lake

What is a data lake? A data lake is an environment or repository of consumable, curated data. It is modular and built-to-order.


Our advisory and linkage services will help you develop the ideal data lake, sourced with curated real-world data aligned to your research goals.


Whether it’s STATinMED RWD Insights, a client’s in-house dataset or other partner sources, we provide custom-built solutions by listening to research needs, identifying the best data, determining feasibility, conducting analysis and communicating value.

See the Big Picture
with Data Visualization

STATinMED’s data visualization tools leverage real-world evidence to uncover the bigger picture for patient populations and disease landscapes, informing unmet needs, high-burden segments, feasibility, and more.

HEAT MAP DIAGRAMS

Our heat map diagrams present national data at the county level on a variety of categorical variables. The maps can present one or two categories simultaneously to tell a clear geographic story.

RADAR CHARTS

Our radar charts are informative visual tools that compare multiple variables and convey a holistic picture.

BUBBLE CHARTS

Our bubble charts present up to three variables simultaneously to visually focus highly granular categories that traditionally take several figures and explanatory text to describe.

Our Proven Approach

Our advisory and linkage services help
clients develop the ideal data
lake,
sourced with curated data that is
aligned with research goals.

The amazing research collaboration between STATinMED and our team has already led to a comprehensive body of evidence to inform confident decision-making for many patients.

Joint Partnership Alliance

Real-World Evidence Executive

Thanks to the entire STATinMED team for all of your hard work and support with many projects – especially for the countless hours, expertise and thoroughness on recent projects. It has been a pleasure to work with you and the team.

Market Access Executive

global biopharmaceutical company

The abstract has been accepted as a podium presentation at ISPOR! Many thanks to the team for all the hard work over the last several months!

HEOR Executive

global biopharmaceutical company

Let’s give kudos to ourselves for everything we have accomplished together. Please share with STATinMED colleagues involved in the study–let them know our deep appreciation for all of them.

Real-World Evidence Executive

Joint Partnership Alliance

On behalf of our study team, I would like to thank you all for your tremendous help on the study. Acceptance by Stroke is a watershed moment for the Real-World Data program.

Real-World Evidence Executive, Joint Partnership Alliance

two global biopharmaceutical companies